In the interest of keeping everyone in our area educated and informed about the state of our real estate market, each month I post the latest statistics for what happened in our market as of the close of business for the previous month. For example, March would show the snapshot for February because the data from March is not yet complete.
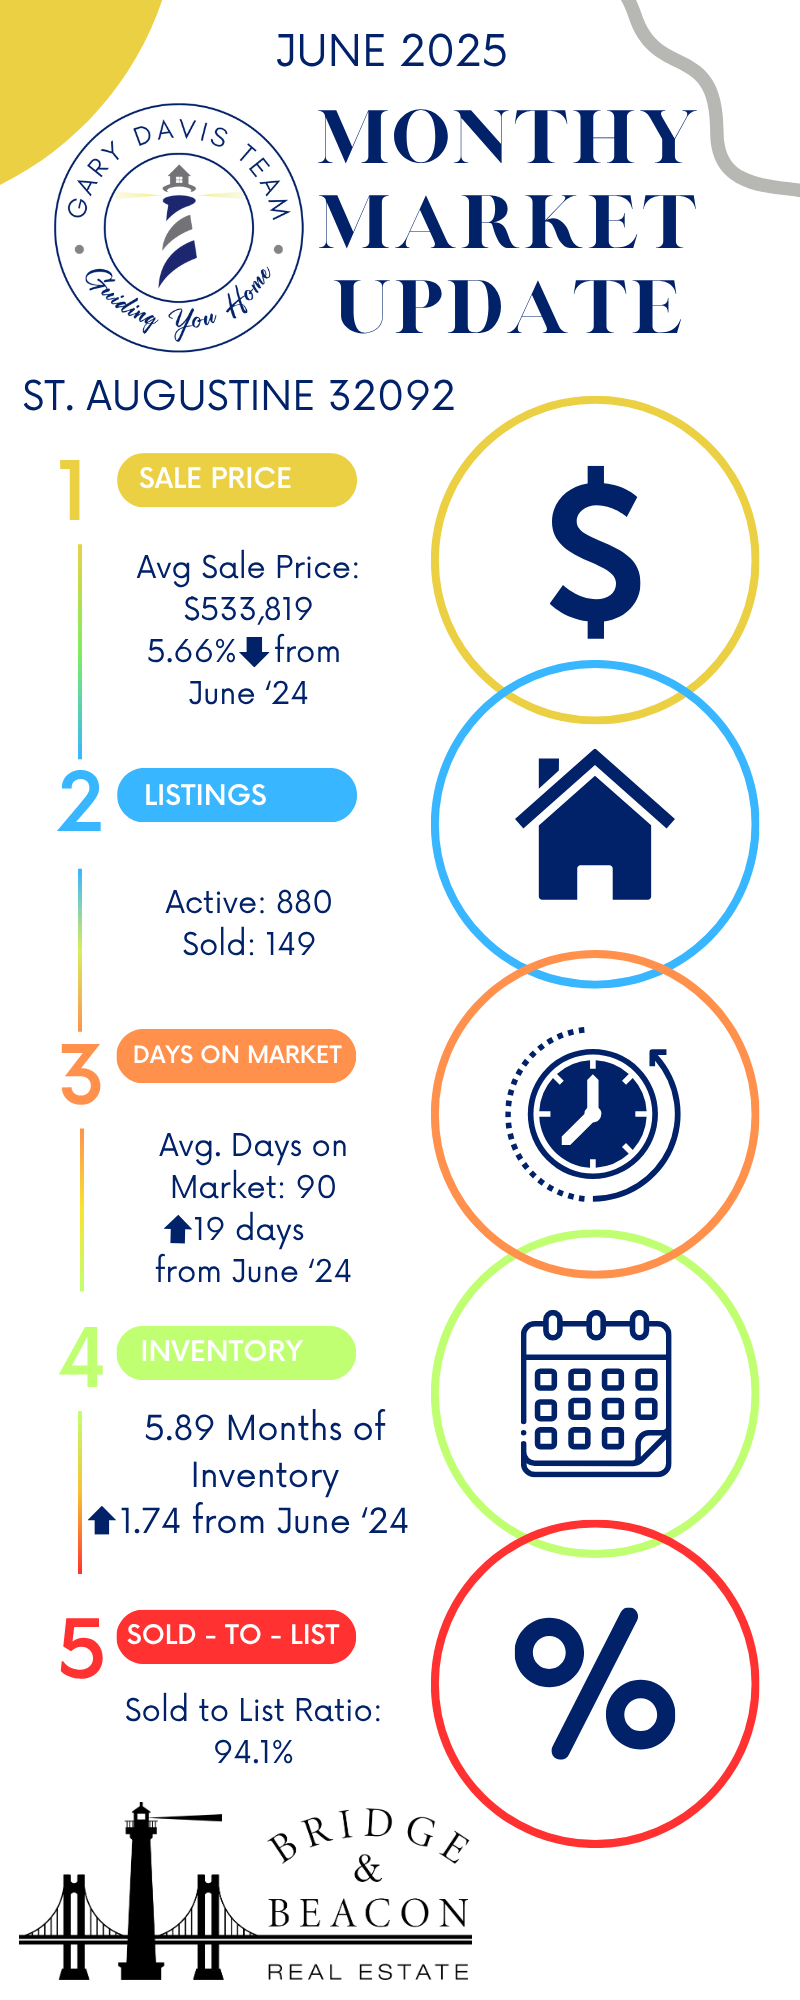
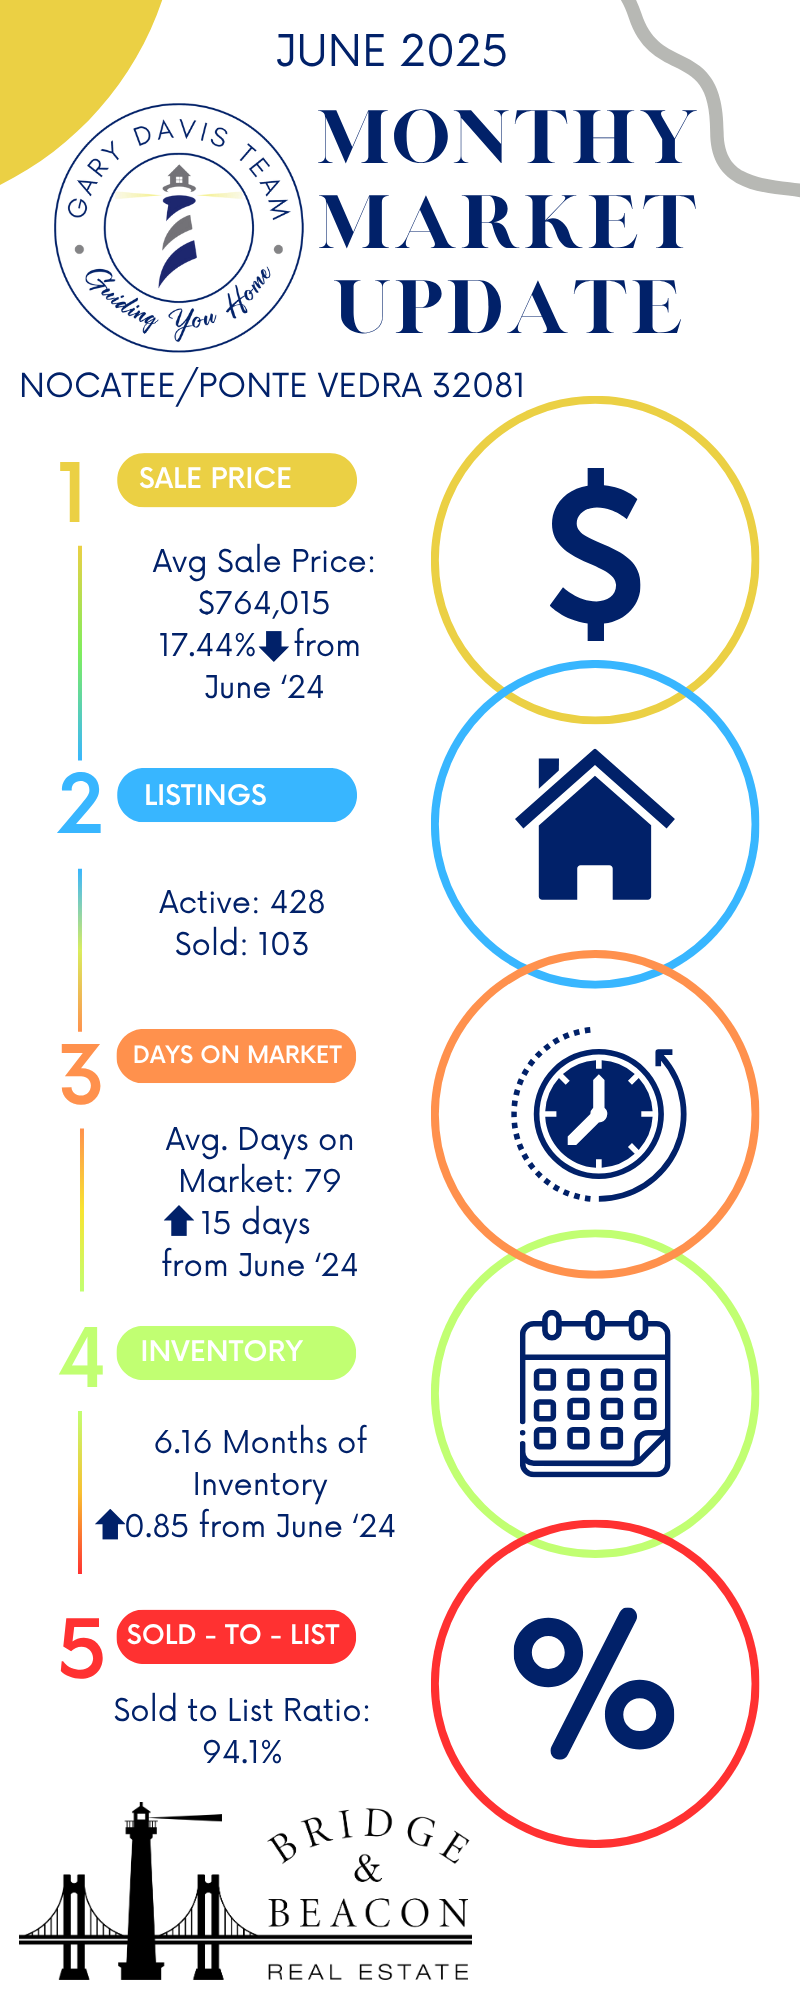
Below are the market snapshots for St. Johns (32259), St. Augustine (32092), and Nocatee/Ponte Vedra (32081)

Some terms to know:
Active Listing: A home that is currently on the market without a contract.
Pending Listing: A home that is currently on the market and under contract.
Sold Listing: A home that has closed and transferred ownership.
Absorption Rate/Months of Inventory: The number of months it would take to sell all of the inventory on the market if no more homes were listed after the time the data was pulled. A balance market is typically 4-6 months for our area.
List-to-Sold Ratio: The percentage of original list price at which the home sold. This is found by dividing the sale price by the listing price. For example: A home that was sold for $295,000, but listed for $300,000 would have a list-to-sold ratio of 98.3%.
Days on Market: This is the number of days from the time the home is listed until the time the home closes.